Main Economic Indicators Income Distribution and Poverty
What is the difference between the Gross National Product (GNP) and the Gross Domestic Product (GDP)?
Gross National Product (GNP) and the Gross Domestic Product (GDP) are two tools to measureeconomicactivityinacountry.However, the GDP is generally preferred in national income measurements since it takes domestic production into account. GNP is the value of all final goods and services produced in a given time period (quarter or year) with the factors of production owned by the citizens of a country. GDP measures cover activities that take place within the geographic borders of the country, while GNP measures cover activities that are attributable to the country’s residents.
What are the prices GDP calculations are based on?
According to World Bank (2019) GDP calculations can be based on three different prices:
- The basic price is the amount receivable by the producer exclusive of taxes payable on products and inclusive of subsidies receivable on products.
- The producer price is the amount receivable by the producer inclusive of taxes on products except deductible value added tax and exclusive of subsidies on products.
- The purchaser price is the amount payable by the purchaser. This includes trade margins realized by wholesalers and retailers (by definition, their output) as well as transport margins (that is, any transport charges paid separately by the purchaser) and non-deductible value added taxes.
The World Bank. (2019b). Viewed on: 15.04.2019, available at: https://datahelpdesk.worldbank. org/knowledgebase/articles/114947-what-is-the- difference-between-purchaser-prices-p.
Which income group classification by the World Bank, does Turkey belong to in 2019?
The World Bank divides countries into four categories according to their income levels. These are low- income economies, lower-middle-income economies, upper-middle-income economies, and high-income economies. Low-income economies are defined as those with a GNI (gross national income) per capita, calculated using the World Bank Atlas method, of $1,035 or less; lower-middle-income economies are those with a GNI per capita between $1,036 and $4,045; upper-middle-income economies are those with a GNI per capita between $4,046 and $12,535; high-income economies are those with a GNI per capita of $12,536 or more (The World Bank, 2019c). According to the World Bank Atlas method, Turkey is located in the upper-middle-income economies in 2019.
What is NACE Rev.2 and when is it used?
NACE Rev.2, which is the economic classification of the Statistical Office of the European Communities, is used when calculating GDP with the production approach, to make national and international comparisons of economic data. Economic activities in NACE Rev. 2 are divided into 21 categories (Eurostat, 2008, 57).
Eurostat (Statistical Office of the European Communities). (2008). “NACE Rev. 2 Statistical Classification of Economic Activities in the European Community”. Luxembourg: Office for Official Publications of the European Communities. Viewed on: 25.04.2019, available at: https://ec.europa.eu/eurostat/ documents/3859598/5902521/KS-RA-07-015- EN.PDF.
Which sectors have a high share in the GDP in developing countries and which sectors have a high share in the GDP in developed countries?
The shares of the sectors in the GDP provide important information about the development levels of the countries and show which industries they specialize in. For example, the shares of agriculture, forestry, fishing, mining, and quarrying are high in the GDP in less developed countries, while in developed countries the shares of sectors such as manufacturing and services are high.
Why is sectors that have a high share in GDP are very important for other sectors?
Sectors that have a high share in GDP are very important for other sectors both due to the GDP growth and sectoral forward and backward linkages. For example, a 10% growth in the manufacturing sector in 2018 in Turkey contributes to approximately 2% GDP growth. Besides, the growth in the manufacturing sector also increases the demand in other sectors that allows an increase in economic growth with its multiplier effect. The size of the services sector in Turkey is remarkable. Since 1998, more than half of the total value-added or production has belonged to the services sector in Turkey. For example, a 10% value-added increase in the services sector in 2018 makes a significant contribution to the GDP of approximately 5.5%.
What is the balance of payments?
Net exports are also referred to as the trade balance, a subsection of the balance of payments. When net exports get a positive value, that is, when exports exceed imports, it is expressed as a trade surplus, and when net exports get a negative value, it is expressed as a trade deficit.
What is the difference between personal income distribution and the functional income distribution?
Economists usually focus on two measures of the income distribution. The first is personal income distribution, which measures how income is distributed among individuals or households, and the other is functional income distribution, which measures how income is distributed among factors of production which are labor, capital, land, and entrepreneurship.
What is Core Inflation and what is ti used for?
Core Inflation or Indicators for the CPIs Having Specified Coverages is a measure of inflation that excludes certain items such as processed food, energy, beverages, tobacco, gold that have volatile price movements. This indicator is used by the Central Bank of the Republic of Turkey (the CBRT) for the construction of monetary policy and inflation trends. Its power of estimation about the future of inflation is very high. Core inflation is the general increase in the prices after the elimination of all temporary influences (TurkStat, 2019)
TurkStat (Turkish Statistical Institute). (2019a). Annual Accounts. Viewed on: 18.03.2019, available at: http://www.TurkStat.gov.tr/PreTablo. do?alt_id=1108.
What are the factors that alter the labor force participation rate?
There are several factors that alter the labor force participation rate. For example, while the adult population is constant if a discouraged worker seeks a job, or housewife works and joins the workforce, this ratio increases. On the other hand, if the number of retirees increases or job seekers become discouraged and stop looking for work, the labor force participation rate drops. The population growth in a country constantly changes the labor force, adult population, and therefore labor force participation rate. When interpreting the labor force statistics of a country, we should interpret the labor force participation rate as well as the unemployment rate.
What does Non-Domestic Producer Price Index measure?
CPI is usually used to measure inflation. TurkStat also measures different price indices to monitor different price movements in the economy.
Non-Domestic Producer Price Index is a measure of the change in the export prices of goods and services sold as output by domestic producers into foreign countries in a given reference period.
Why did inflation raise in Turkey in 1970's and 1980's?
It is seen that inflation in Turkey was at a reasonable level until 1970. Internal (budget deficits, foreign trade deficits, money supply increases, devaluations, and political instability) and external (the first oil crisis, The Cyprus Peace Operation, and the second oil crisis) economic instabilities experienced in the 1970s and 1980s in Turkey generated inflation to reach 80% and price fluctuations become unstable.
What are the main reasons for the high inflation in Turkey during 1990's?
In the 1990s, the Turkish economy has become fragile because of short-term capital inflows, increases in foreign debt, budget deficit, and current account deficit. With the invasion of Kuwait by Iraq in 1990-1991, Turkey reached a risky position and short-run foreign capital outflow. The increasing exchange rate raised the current account deficit, debt stock, and interest rates, thus, inflation reached 70% in 1992. The economic crisis that occurred in 1994 caused 106% of inflation in Turkey. Among the reasons for high inflation were monetizing the budget deficits, cancellation of government bond auctions, and a weak banking sector. Similarly, with the impact of the Asian and Russian economic crisis in 1997- 1998, the inflation rate in Turkey was around 85% through an enormous amount of capital outflows, high exchange rates, and interest rates.
For what purpose the inequality ratio or share ratio is calculated?
Inequality ratio or share ratio is method used to measure income inequality which is is the disparity distribution of income among households. The Inequality Ratio which is also expressed as P80/ P20 is the ratio of the top 20%-the highest income group' income to the bottom 20%-the lowest income group's income.
What is lorenz curve and what is its purpose in calalulatin income inequality?
The Lorenz Curve is a graphical depiction of income inequality. It is a graph depicting the variance of the size distribution of income from perfect equality. Gini coefficient is a measure of income inequality within a population, ranging from zero for complete equality, to one if one person has all the income (Deardorff, 2016).
A widely used method to measure income inequality is the Gini Coefficient that is calculated using the Lorenz Curve.
How is the Gini Coefficient calculated?
The Gini Coefficient can be obtained by calculating the ratio of the area between the diagonal and the Lorenz curve divided by the total area of the half-square in which the curve lies.
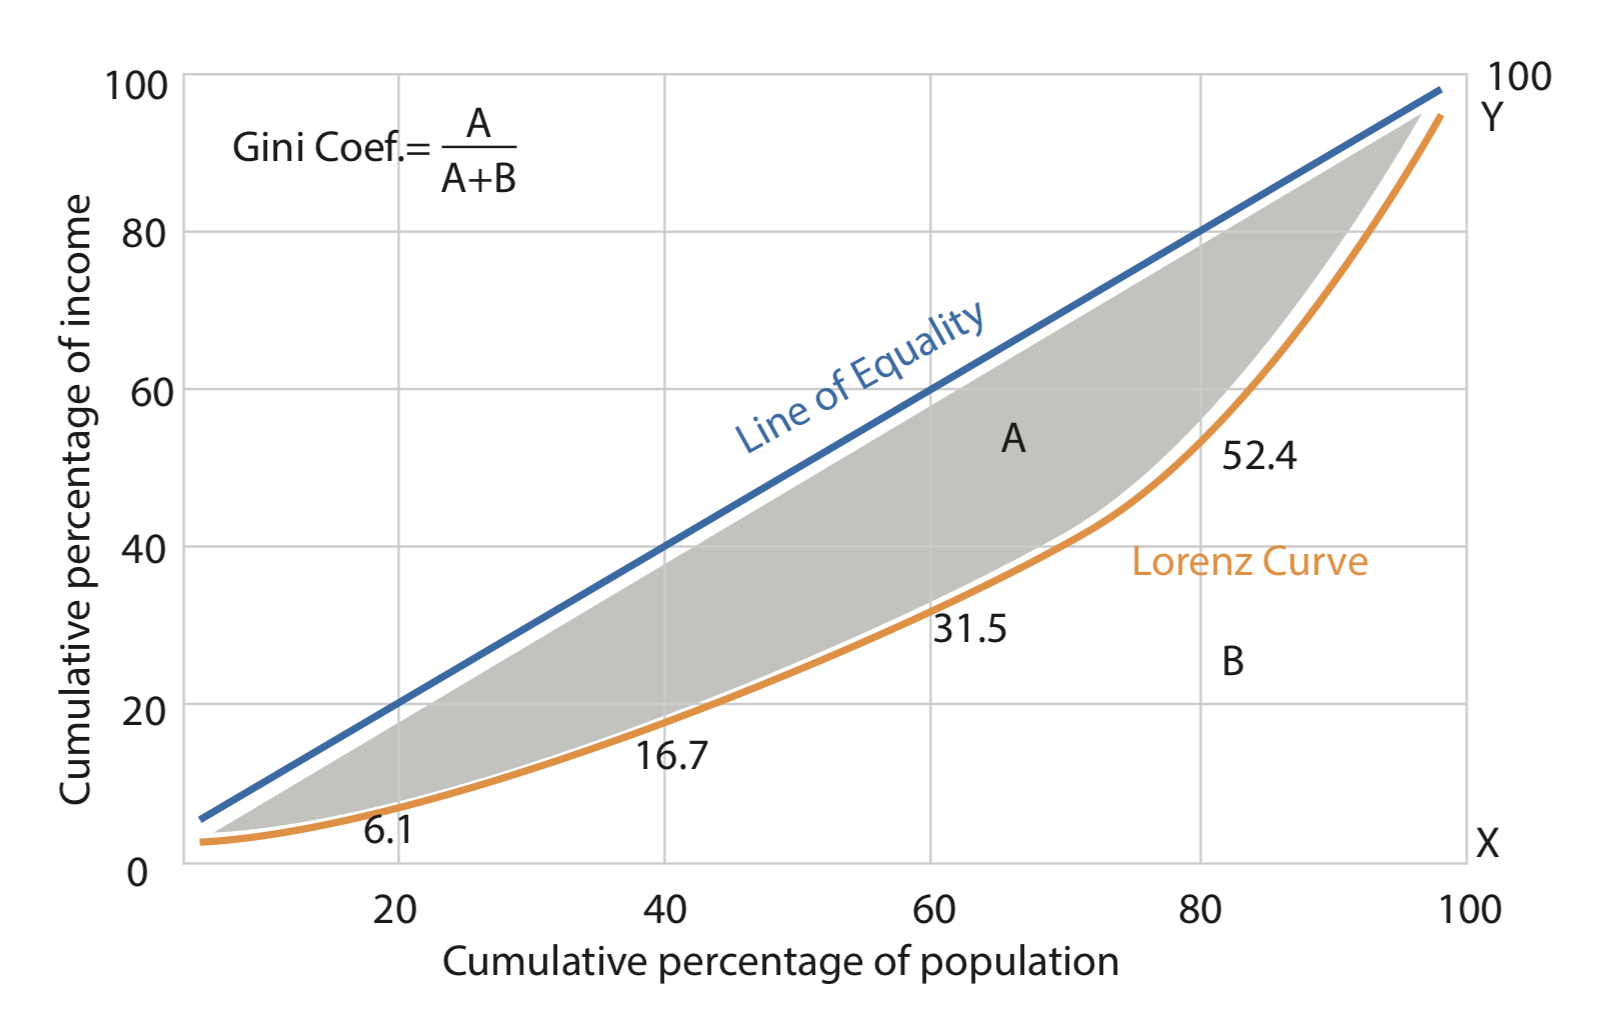
IT is the ratio of the shaded area A to the total area of the triangle 0XY which is equal to the total area of A and B. Thus the coefficient can be calculated simply by the following formula:
![]()
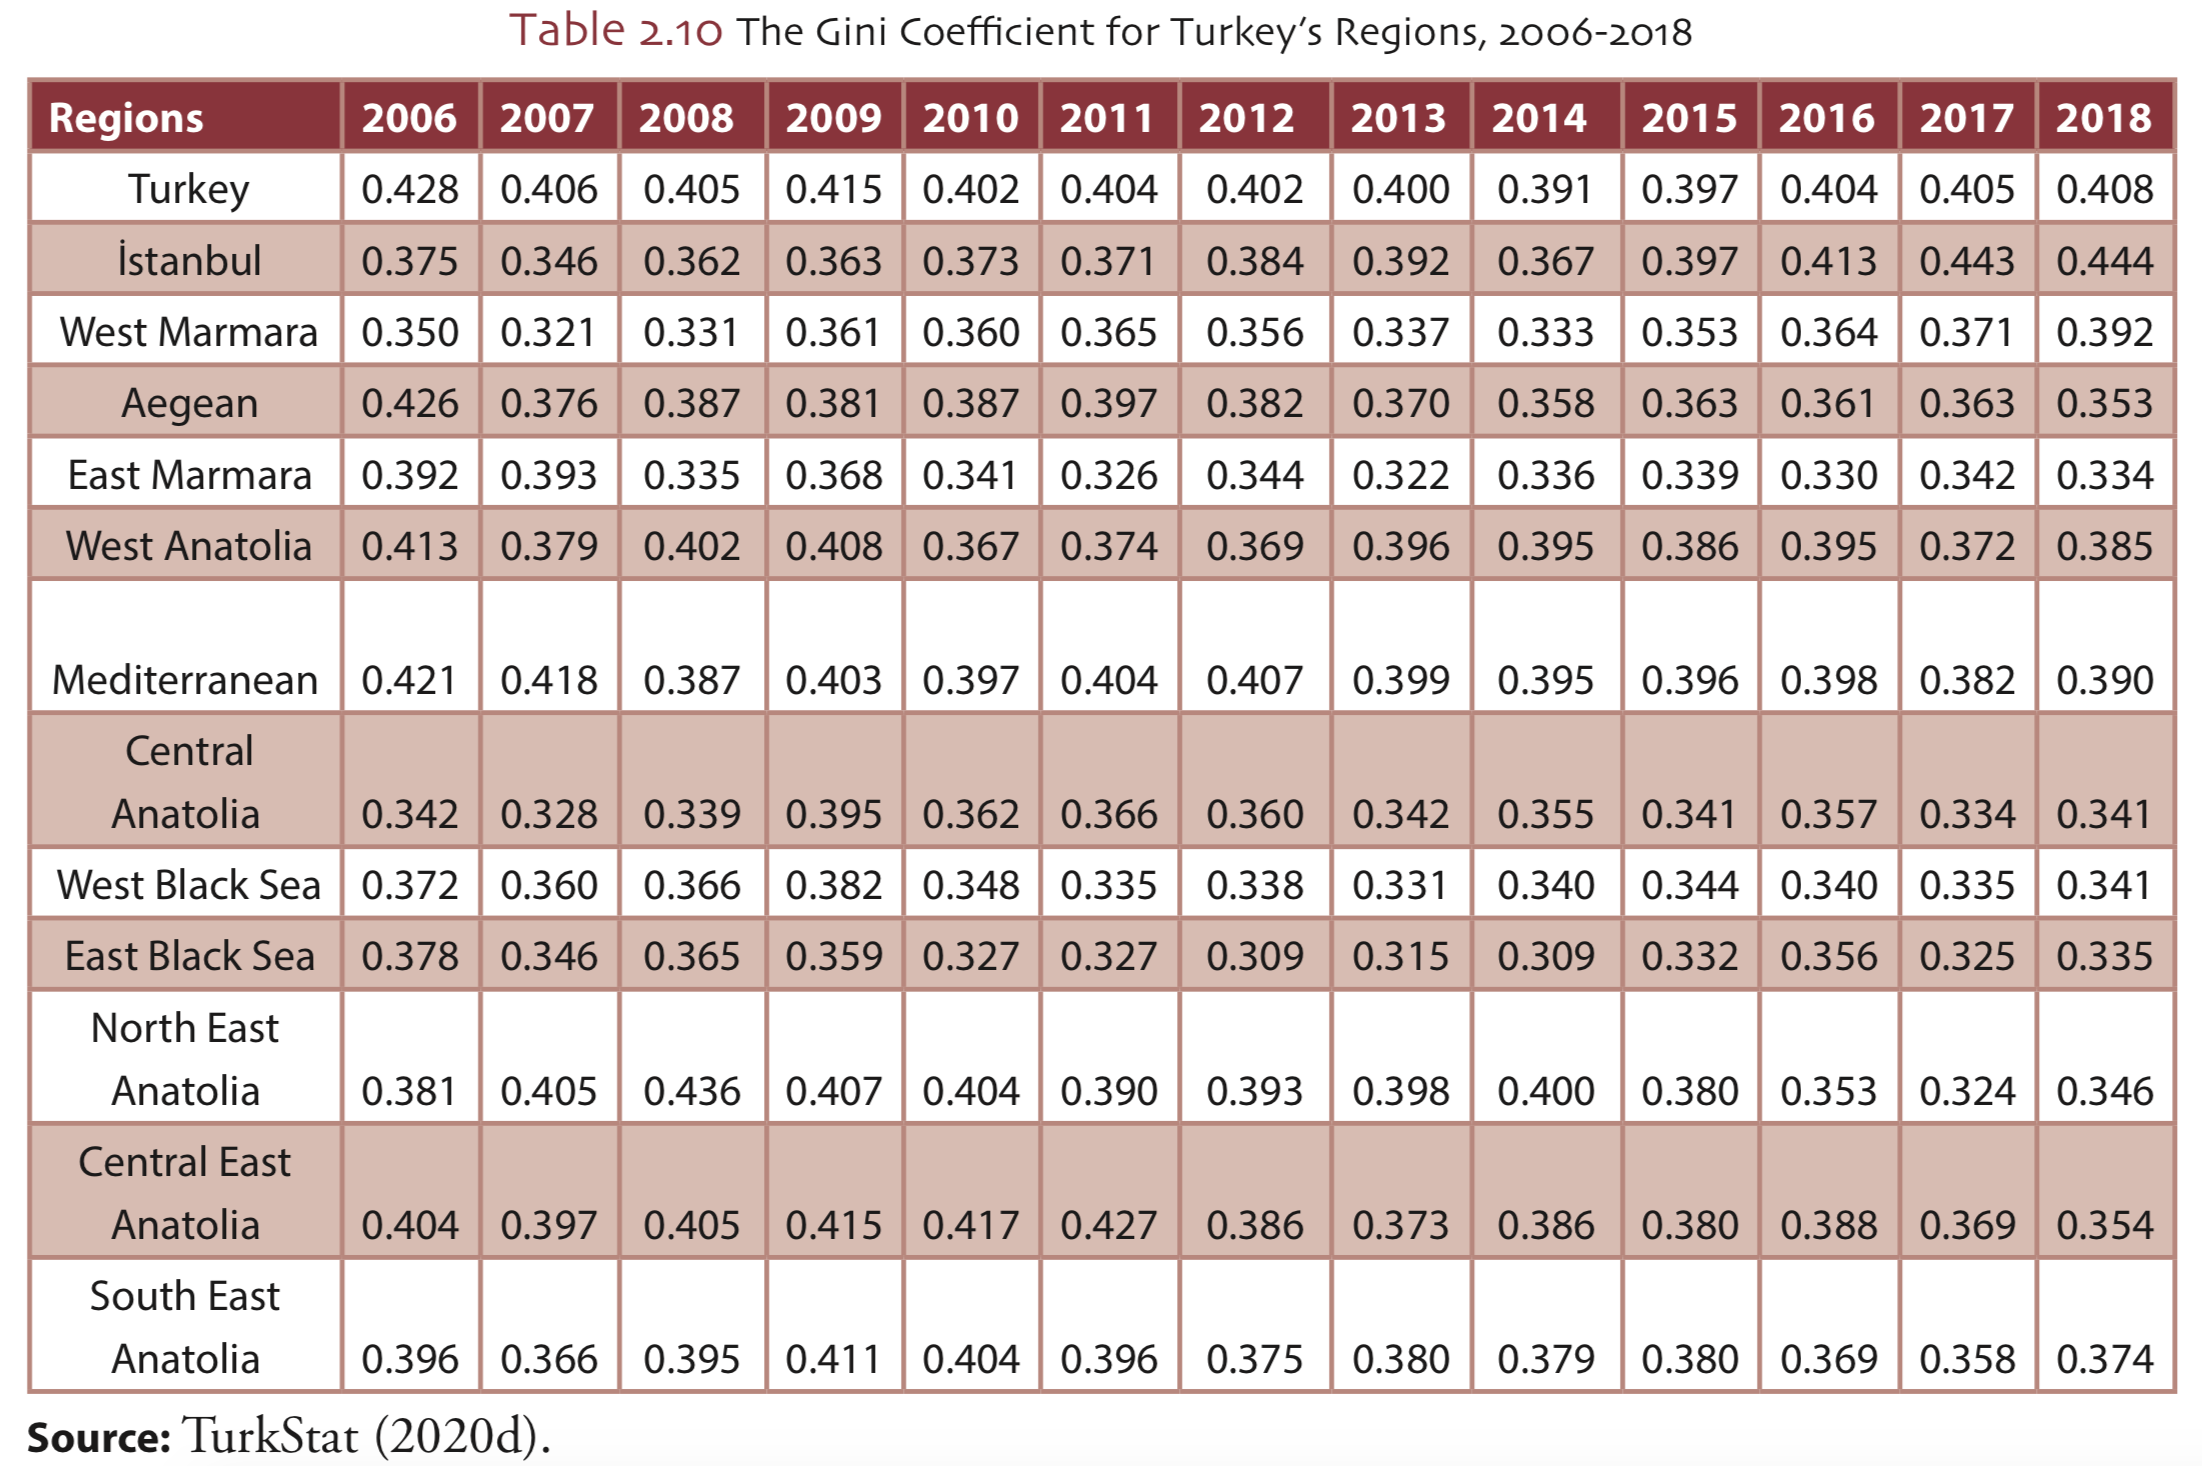
Which regions in Turkey has the highest income inequality?
As of 2018, while the regions with the highest income inequality are Istanbul and West Marmara, the regions with the lowest are East Marmara and East Black Sea.
What is "functional income distribution"?
Functional Income Distribution, another income distribution measurement, is the shares of or the contribution of factors of production income in total national income or GDP. The functional income distribution provides essential information for evaluating individual share in national income. Through functional income distribution, it can be seen how the factors of production (labor, capital, entrepreneur, and land) derived incomes (wages, interest, profit, and rent) are distributed in a country and how these incomes change over time. In functional income distribution, unlike personal income distribution, income differences between rich and poor are not considered. Instead of looking at the income of individuals or households separately, the derived incomes divided into 8 by TURKSTAT are considered. In the functional income distribution, the income shares earned by labor, capital, entrepreneur, and land in a country are examined.
What is the difference between absolute poverty and relative poverty?
Although there are different definitions of poverty, two definitions which are absolute poverty and relative poverty are commonly used. Absolute Poverty also sometimes used as a synonym for Extreme Poverty is a specific minimum level of income needed to satisfy the basic physical needs of food, clothing, and shelter to ensure continued survival (Todaro and Smith, 2012).
Relative Poverty is when household income is below the average welfare level of the society (for example, below 50% of the median income). While absolute poverty takes basic needs into account, relative poverty considers the average income or median income in society. For this respect, the households having incomes and expenditures below a specified line compared to the general population shall be defined to be the poor in a relative meaning (TurkStat, 2019)
Todaro, M. P. & Smith, S. C. (2012). Economic Development, 11th Edition. New York: Addison-Wesley.
TurkStat (Turkish Statistical Institute). (2019). Poverty Statistics. Viewed on: 22.11.2019, available at: http://www.TurkStat.gov.tr/PreTablo. do?alt_id=1013.
What is the relation between poverty line and the poverty rate?
The World Bank has determined a minimum level of income or poverty line for determining absolute poverty. As differences in the cost of living across the world evolve, the global poverty line has periodically been updated by the World Bank. The international poverty line was $1 per day between 1990 to 2005, $1.25 per day between 2005 to 2015. The international poverty line has been determined at $1.90 per day since 2015. The ratio of the population below the $1.9 per day income or spending level to the total population is the poverty rate.